Bicycle Bumpy-road Mapping
Contents
Introduction
This project arose from my experience in riding my bicycle around my neighborhood and (to some extent) in the larger Detroit area. I realized that some of the roads are newly-paved smooth and some are like pot-holes and patches; and everywhere in between. And there is no way to predict that a particular route will be smooth (although, in general, bike routes tend to be a little better). So, I hit on the idea of making a mapping (and route planning) system that accounts for bike-ride smoothness. And realized that first, I would have to collect the data. So, the first phase of the project is a system for collecting and integrating geo-indexed road-roughness data.
So, currently, I envision an integration of three stages:
- a bike-mounted data collection system based on GPS and accelerometer data
- a background system to off-load the data, map it to a geo-location database, characterize "roughness", and provide particulars and summaries of roughness on a per-street bases.
- a mapping and route-planning system that takes roughness into consideration
This page described version one of the system. There are also some notes on Version Two of Bicycle Bumpy-road Mapping.
Bike-Mounted Data Collection System
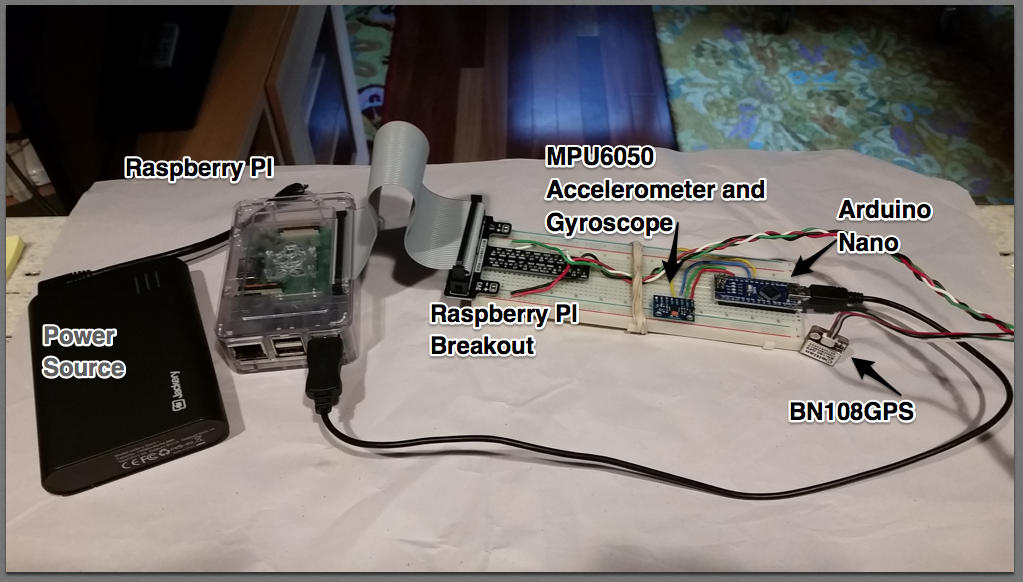
There are five major hardware components to this system:
- a portable power supply - currently a Jackery rechargeable phone battery, 5V, rated at 12Ah (limited, I believe, to 1.2A)
- Raspberry PI
- Arduino Nano
- MPU6050 - an Accelerometer/Gyroscope combination with a Motion Processing Unit (although, at this time, I am only used the raw data)
- BN108GPS - providing an data stream of GPS information
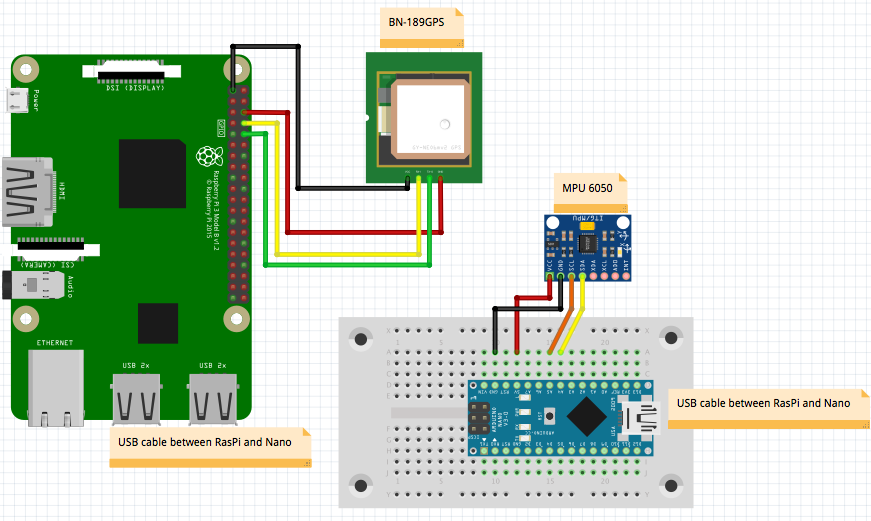
As in the picture, (1) the Raspberry Pi and Arduino are connected view USB, the serial output of the Nano showing as a input to the Pi, (2) the MPU6050 is connected to the Nano via the SP lines, and (3) the GPS module is connected to the Pi. Details in this screenshot of the Fritzing diagram.
I did an initial run of just the bump detection by wrapping the Power/Pi/Nano/MPU6050 combination in rubber bands surrounded by a wrapping of old socks and strapped into the basket of my bicycle. This provided data interesting and convincing enough to proceed.
Packaging for the Ride
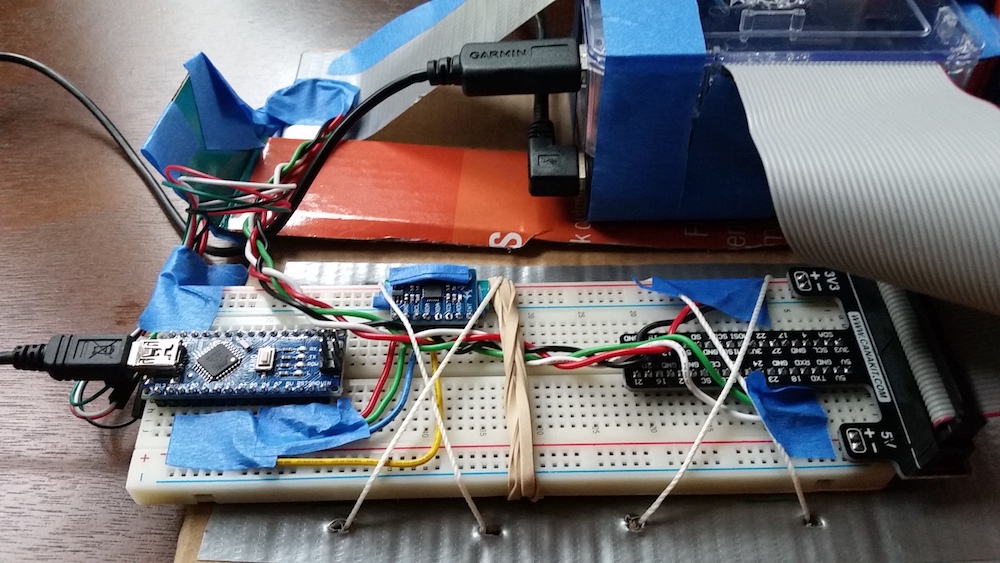
The initial packaging of the complete system uses a cardboard back/foot with duct tape for reinforcement and masking tape for attachment: the battery and Pi are taped together, in such a way the they can be connected, and strapped to one side of the board, while a breadboard with the Nano and MPU6050 is strapped to the other side of the board, with the GPS on a cardboard "wand" above the top of the Pi/Battery piece, a USB cable connects the Pi and the Nano:
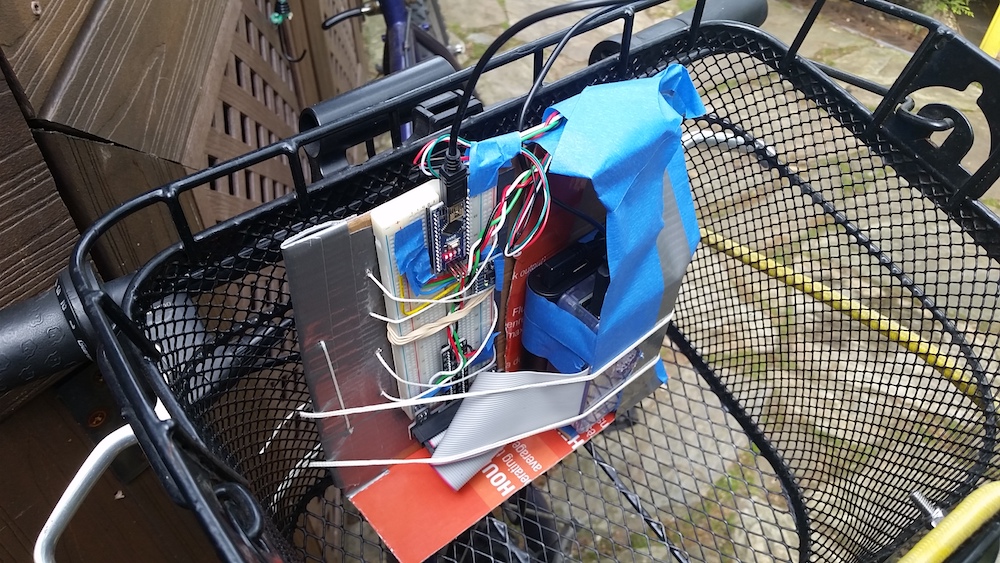
This assemblage, in turn, is strapped into my bicycle basket using strings threaded through the cardboard and an initial set of string loops that are secured with bungie cord (yellow, in the picture), that pulls the string taught and is wrapped around the basket (through supports in the top of the front, so that the cord will not slip down). During its first trial run, but GPS Module was bumped off it's connections and found in the bottom of the basket (fortunately!). So, it is now covered in masking tape, to keep it in place.
One nice thing about using the Raspberry Pi is that I can connect to it over the LAN using SSH. Log in, start everything, check status for all running correctly, and then log out. And the Pi will still be running: all data collection as background tasks. Then later sftp onto Pi and upload data log to processing machine. This means that I can connect it up, strap it in place, and do everything else remotely. All I have to do "hands on", is manage the power.
Collecting and processing data
- Arduino Nano collects raw accelerometer and gyroscope data every 0.1 second. It writes the data to Serial out.
- The Raspberry Pi runs two threads, one reads and saves the GPS data (time, latitude, longitude, altitude, and speed), the other reads the raw accelerometer and gyroscope data from the Nano. For every Nano record, the program writes a record to a file combining it with the current GPS data.
- At the end of the data run, the file is downloaded from the PI.
- Then the datafile is loaded into a PostgreSQL database. The database is augmented with PostGIS - the geographic, geometric, plugin) and OpenStreetMaps data for mu local area.
- Data from each data-run, which I am calling a track, is run thought a series of evolving cleanup scripts (section: Cleaning up Data).
- Preliminary analysis, so far, is visual - the track data (in various forms) is drawn on maps, using Leaflet.
Road Bumpiness Data
Initial data runs
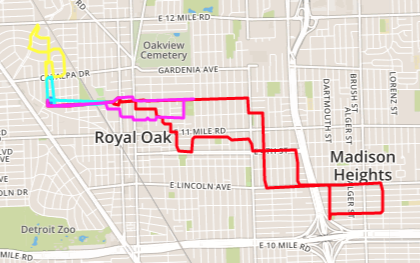
For the initial set of data runs, I ended up collecting four tracks, in trips ranging from 10-55 minutes on various roads in my neighborhood. This screen shot shows those tracks, with a color coding corresponding to track number.
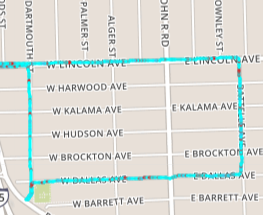
With each track the GPS data is collected every second. From that data, an approximation of bumpiness is computed: currently I am just using the maximum acceleration value in the sample as the 'roughness' measure for that sample. For example, this portion of 'red' track, above, the loop in Madison Heights, shows that roughness measure approximated by a color coding (the redder values being the rougher spots - this one is a relatively smooth ride):
A couple of close up shots show a typical problems. Some data (equipment failure, in this case) is clearly not on any road, this also includes cutting through parks, or other non-road stretches of riding - which I am currently eliminating by hand:

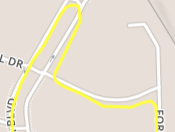
Even 'correct' tracks are often not on roads, so some effort is needed to match up road segments and track portions:
Cleaning up data
Some ideas, that I am working on, for cleaning up the data:
- From time to time (stop lights in the like) the platform is not in motion and so a pile of one-second reads gets mashed together. These could be eliminated (or marked as 'uninteresting'), right now, since they are low values with respect to roughness, I am just letting them pile up.
- Ultimately, I want each data item mapped to specific road segment. I am using road data from OpenStreetMaps to obtain the position of the roads that I am riding on, but the inherent sloppiness of the GPS data makes exact identification of the road in question a little difficult. For example: mapping each point the the nearest road leads to a curious artifact - points at intersections often get mapped to the cross-street:

Mostly I am fixing there on a case by case bases by writing scripts in iterating on them to identify and correct problems.
The data and the scripts are on github.
On Going
Next Steps
- Learning Geo-based queries and getting data into geo-database (using Postgres with PostGIS)
- Classification of route segments with respect to roughness categories (smooth to 'argh')
- Colorization of route on map, based on roughness categories (heat map colors, most likely)
- Route planning based on a roughness/distance-off-track cost (have to play around with that one)
- Repackaging: 3D Printing for MPU6050, GPS device, Arduino, Raspberry Pi
- smaller Pi? Raspberry Pi Zero W?
- use only Pi (eliminate Arduino)?
- Need to do some prototyping and testing
Thoughts on Improvements
Packaging. I want to get the mess that is the physical part of this system into a more compact and permeant packing. I would like to be able to easily replace the components (e.g. the power supply, the GPS module), but have everything in packaging that is compact and wiggle-free-proof. Fabrication is not a strong suite for me as I have tended to rely of the cardboard and tape approach seen here.
Roughness mapping to roads. I think that this will have two phases: classification of street segments (sub-segments) and display. One open problem is that the GPS tracks are close to, but not always on, the road in question, so I am looking for a solution to that problem.
Auto starting. It would be nice, eventually, to have the Pi, on power-up, automatically start all the programs that need to be running and check their status; perhaps with red/green LED pair to let me know that the all is ready to go for data recording.
Web-based data harvesting. Replace the current (SFTP + utility programs) manual data harvesting with an automatic process that runs at regular intervals to harvest data when the Pi is "at home" and running.
Suggestions from others
@alenhart (Slack): I found the on-board OLED display I used very handy for looking at data and status on the road. I also made a bar graph on the OLED that indicated the output of the accelerometer.
